It is possible to create a vowel chart using Praat and Microsoft Excell.
To create a vowel chart from your sound recordings in Praat, open Praat and in the ‘Praat Objects’ window, click New→ Record Stereo Sound.
Once recorded, click ‘Save to List’ to use that sound file, and select ‘View and Edit’.
Highlight a section of a vowel you want to analyze in your sound file.
The ‘SEL’ button zooms on just what you have selected. Click the bottom bar to play selected segment.
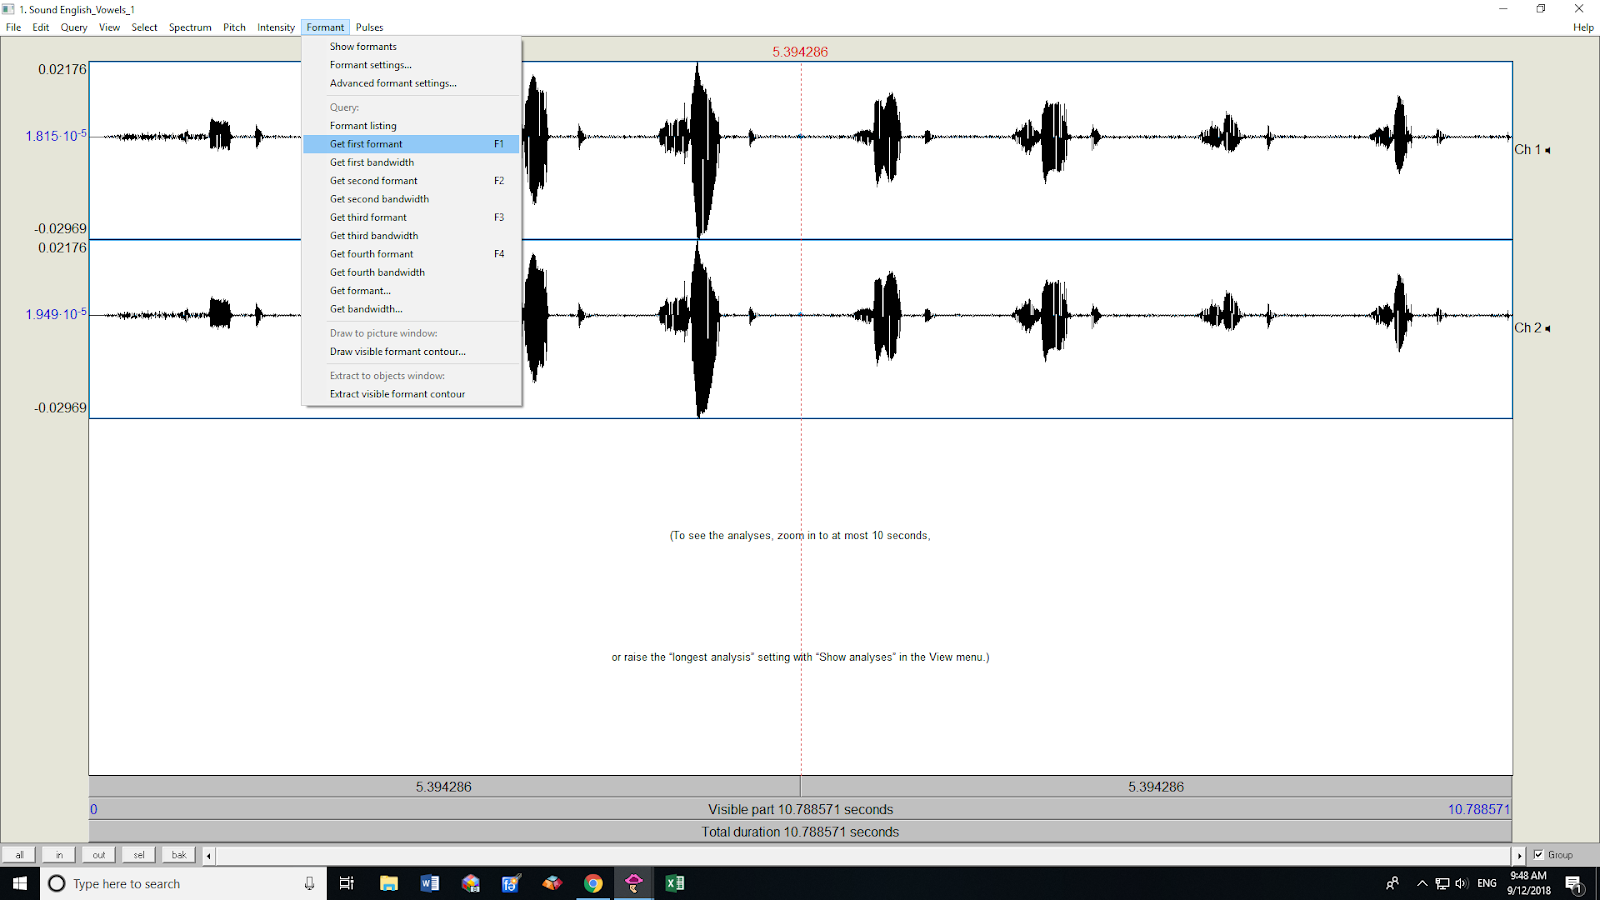
Set your window to ‘Show Formants’.
Click 'Formant'→ 'Get 1st formant' (simply pressing the F1 or F2 key on your keyboard is a faster shortcut):
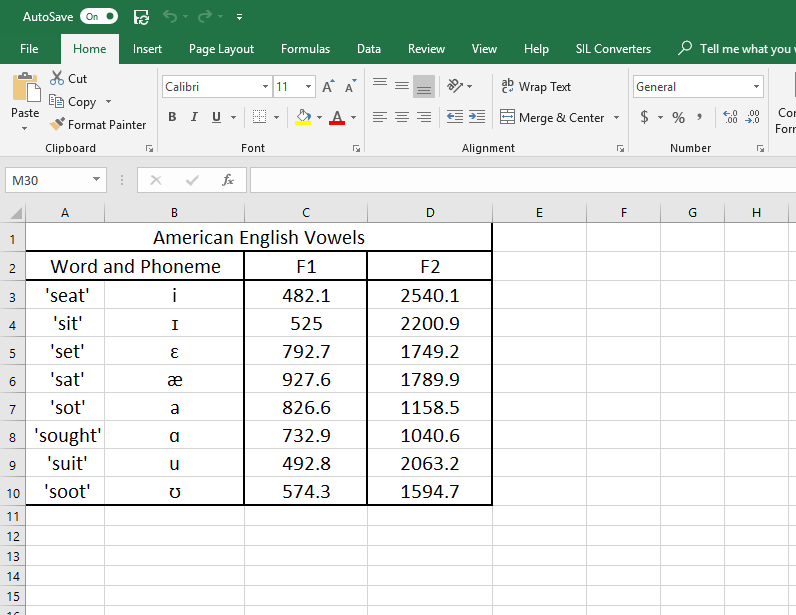
Open a new sheet in Microsoft Excell and paste your F1 and F2 values into columns as shown:
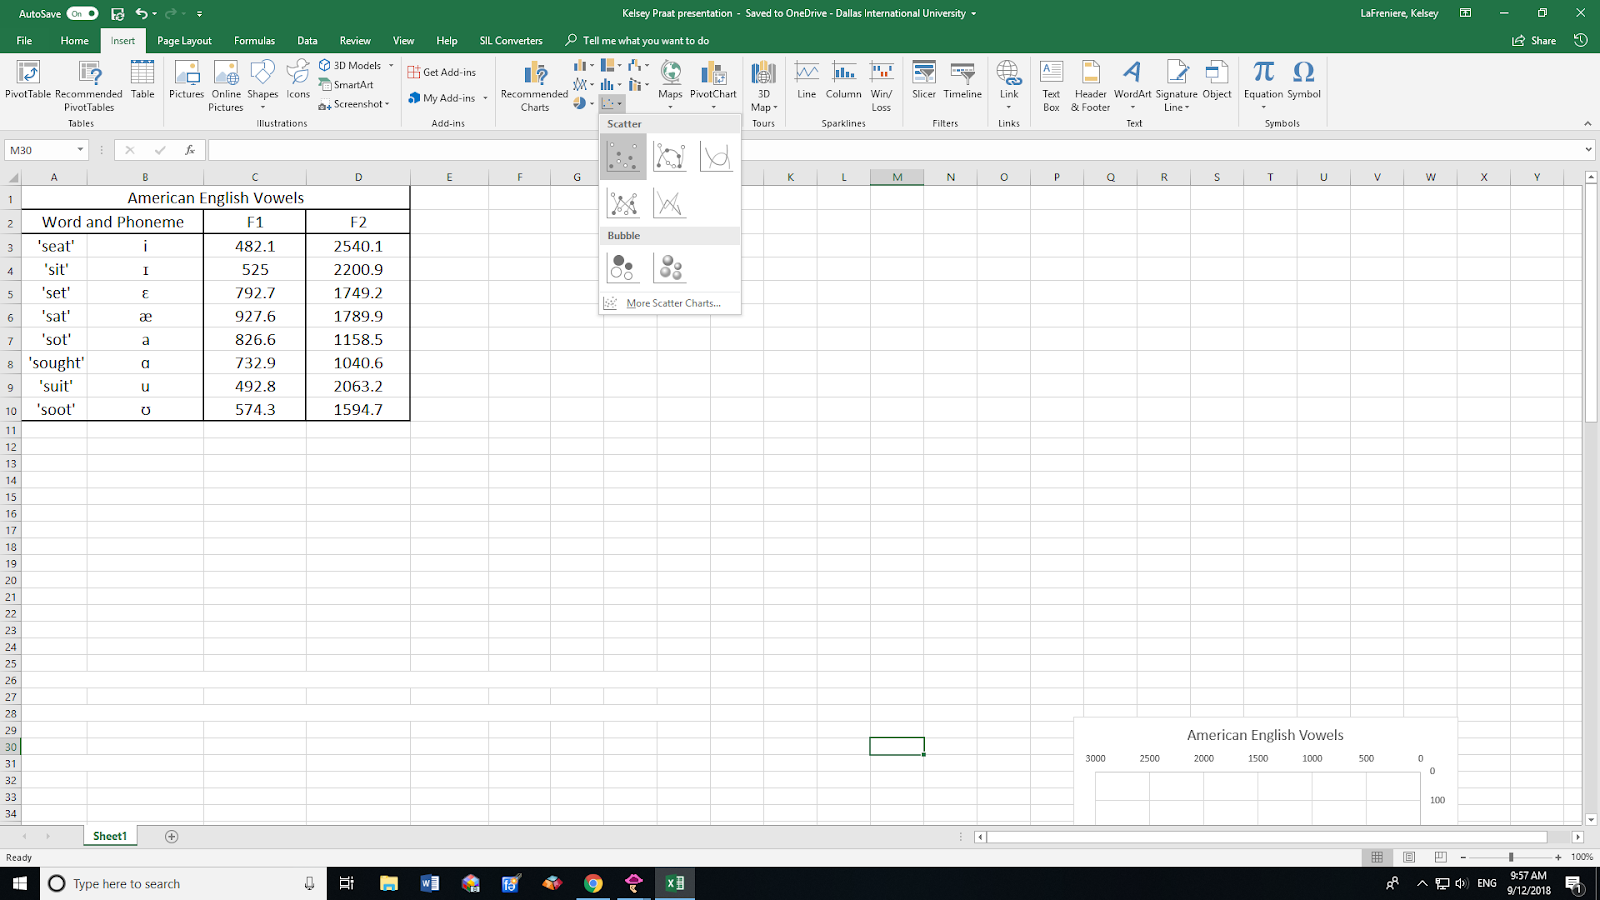
Select data for your new chart by first clicking on the chart. The, up at the top under ‘Design’ click ‘Select Data’. Click ‘Add' to add a series of data.
Vowels have clusters of energy at different frequencies, which allow us to tell them apart. These are called formants. To create a vowel chart, we are concerned with only the 1st and 2nd formants of your vowels.
It is important to know that F1 values have an inverse correlation to vowel height, and F2 values have a more-or-less inverse correlation to vowel backness, but complicated by the effect of lip rounding (Ladefoged and Disner 2012: 40-41).
Add an appropriate Series Name for your vowel chart, then to select your Y-values, click in the ‘Series Y values’ blank and then drag your cursor over the column of F1 values in your table to select just those numbers:

Do the same to select the X-values for your chart: click in the ‘Series X values’ blank and then drag your cursor over the column of F2 values in your table to select just those numbers.
On the 'Format Axis' pane that pops up, under the 'Axis Options' header with an arrow, select 'Horizontal Value Axis'. Scroll down and check the box titled 'Values in reverse order'. Do the same for 'Vertical Value Axis' settings.
This will take care of the inverse correlation that your formant values have.
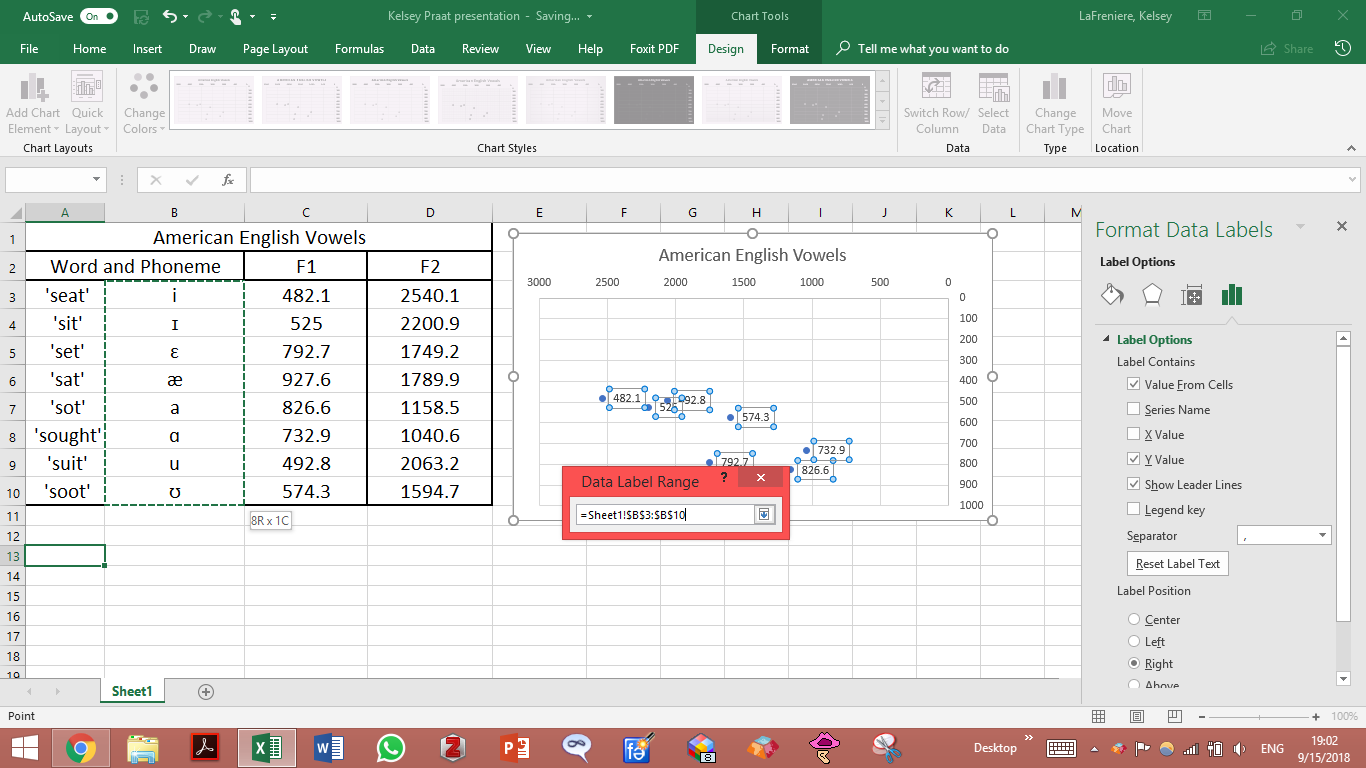
If you'd like to see more clearly what points you have plotted on your chart, click on one of your points. This should highlight all the points. Right click on the point and select ‘Add Data Labels → Add Labels’. Then right click on a point again to go to ‘Format Data Labels’. In the formatting pane, you can choose to have a ‘Value from the cells’ be the label. So, check that box and then click and drag to select the column from your data that has your vowels in it.
Your chart may still not look as properly spaced as other published vowel charts do. Don't be discouraged. Keep in mind a few things: the way you adjust the chart's axes can greatly distort/correct the way your chart looks. Also, in your actual sound recording, surrounding consonants like nasals can affect your vowel formants. So, no vowel recording or chart will be perfect, but this rendering in Excell can get you started. Best of luck!